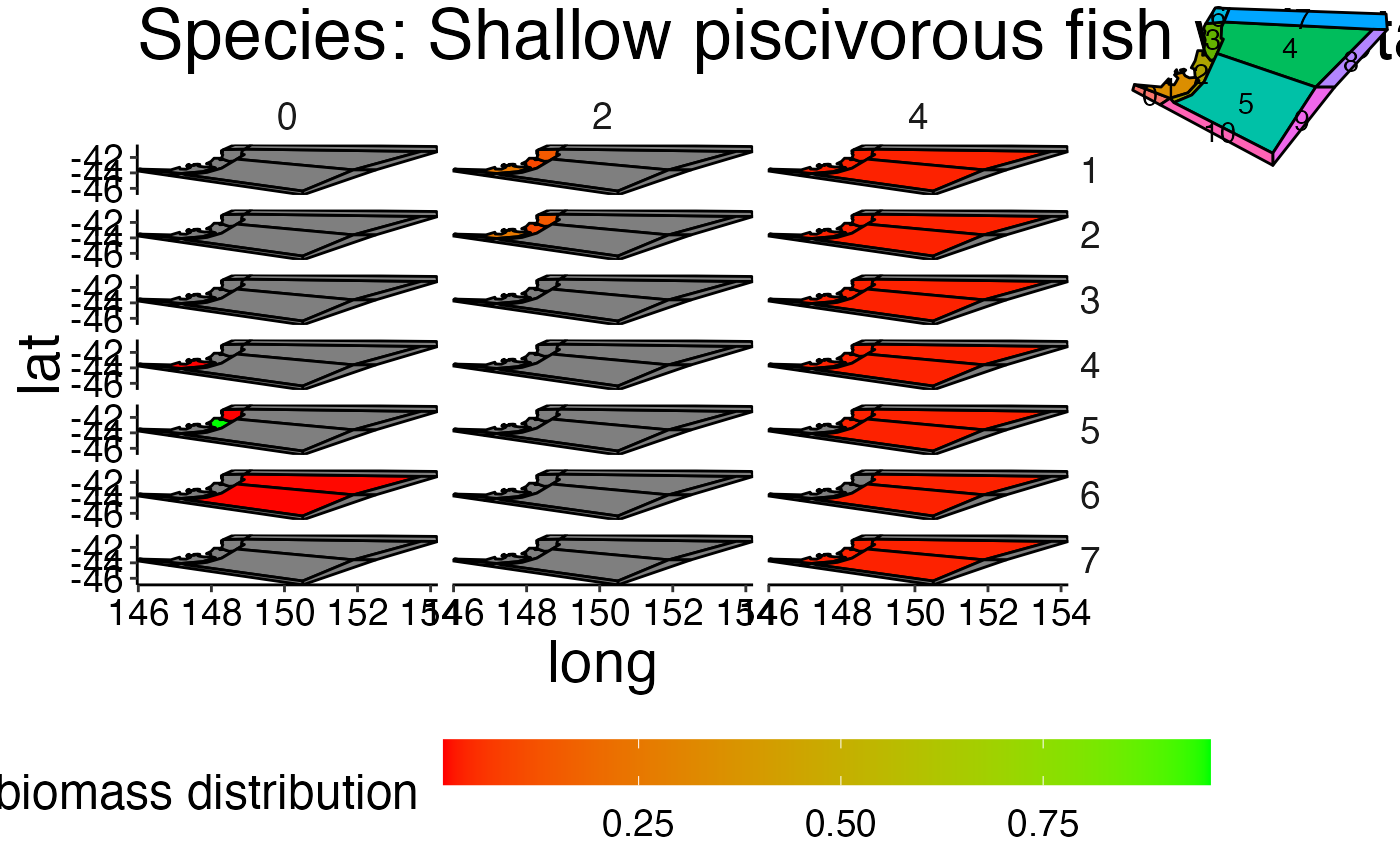
Visualize the spatial distribution per species and stanza combination.
Source:R/plot-spatial-box.R
plot_spatial_box.RdVisualize the spatial distribution per species and stanza combination.
Usage
plot_spatial_box(
  bio_spatial,
  bgm_as_df,
  select_species = NULL,
  timesteps = 2,
  polygon_overview = 0.2
)
Arguments
- bio_spatial
Biomass per group and stanza in tonnes for each timestep, layer and polygon. This dataframe should be generated with
calculate_biomass_spatial. The columns of the dataframe have to be 'species', 'species_stanza', 'polygon', 'layer', 'time' and 'atoutput'. Column 'atoutput' is the biomass in tonnes. Please usecombine_agesto transform an age-based dataframe to a stanza based dataframe.- bgm_as_df
*.bgm file converted to a dataframe. Please use
convert_bgmto convert your bgm-file to a dataframe with columns 'lat', 'long', 'inside_lat', 'inside_long' and 'polygon'.- select_species
Character vector listing the species to plot. If no species are selected
NULL(default) all available species are plotted.- timesteps
Integer giving the number of timesteps to visualize. Default is
2. By default the start and end of the simulation is shown. In case timesteps > 2 equally spaced timesteps are added.- polygon_overview
numeric value between 0 and 1 indicating the size used to plot the polygon overview in the upper right corner of the plot. Default is
0.2.
Examples
d <- system.file("extdata", "setas-model-new-trunk", package = "atlantistools")

bgm_as_df <- convert_bgm(file.path(d, "VMPA_setas.bgm"))

# Spatial distribution in Atlantis is based on adu- and juv stanzas.
# Therefore, we need to aggregate the age-based biomass to
# stanzas with \code{\link{combine_ages}}.
bio_spatial <- combine_ages(ref_bio_sp, grp_col = "species", agemat = ref_agemat)
#> Joining with `by = join_by(species)`

if (FALSE) { # \dontrun{
# Apply \code{\link{plot_spatial_box}}
grobs <- plot_spatial_box(bio_spatial, bgm_as_df, timesteps = 3)
gridExtra::grid.arrange(grobs[[1]])
gridExtra::grid.arrange(grobs[[9]])

# use names() to select specific plots
names(grobs)
} # }

# Plot specific species
grobs <- plot_spatial_box(bio_spatial, bgm_as_df,
                          select_species = "Shallow piscivorous fish", timesteps = 3)
#> Joining with `by = join_by(polygon)`
#> Coordinate system already present.
#> ℹ Adding new coordinate system, which will replace the existing one.
#> Coordinate system already present.
#> ℹ Adding new coordinate system, which will replace the existing one.
gridExtra::grid.arrange(grobs[[1]])