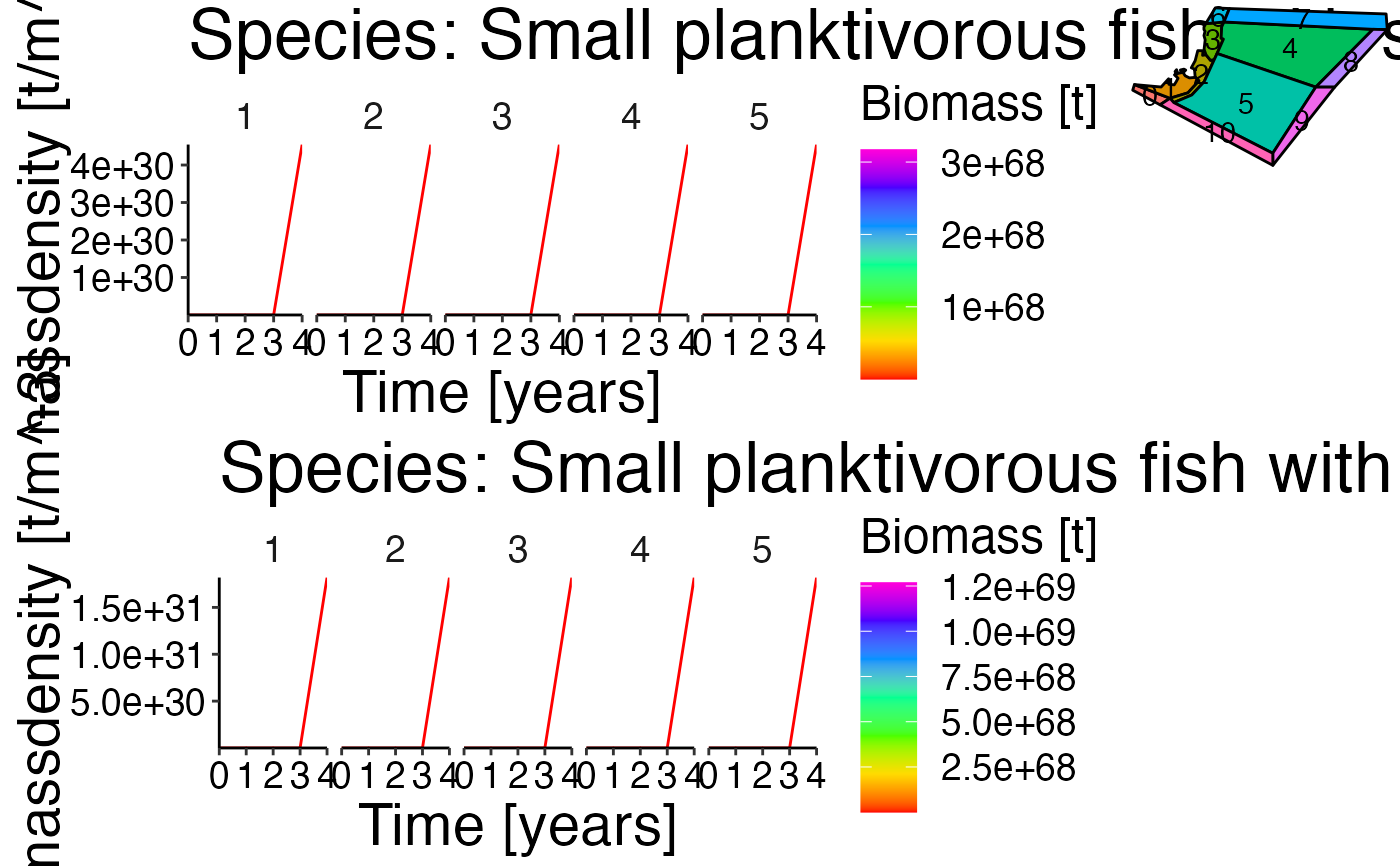
Visualize the spatial distribution per species and stanza combination.
Source:R/plot-spatial-ts.R
plot_spatial_ts.RdVisualize the spatial distribution per species and stanza combination.
Usage
plot_spatial_ts(
  bio_spatial,
  bgm_as_df,
  vol,
  select_species = NULL,
  ncol = 7,
  polygon_overview = 0.2
)
Arguments
- bio_spatial
Biomass per group and stanza in tonnes for each timestep, layer and polygon. This dataframe should be generated with
calculate_biomass_spatial. The columns of the dataframe have to be 'species', 'species_stanza', 'polygon', 'layer', 'time' and 'atoutput'. Column 'atoutput' is the biomass in tonnes. Please usecombine_agesto transform an age-based dataframe to a stanza based dataframe.- bgm_as_df
*.bgm file converted to a dataframe. Please use
convert_bgmto convert your bgm-file to a dataframe with columns 'lat', 'long', 'inside_lat', 'inside_long' and 'polygon'.- vol
Volume per polygon and timestep. See model-preprocess.Rmd for details.
- select_species
Character vector listing the species to plot. If no species are selected
NULL(default) all available species are plotted.- ncol
Number of columns in final plot. Default is
7.- polygon_overview
numeric value between 0 and 1 indicating the size used to plot the polygon overview in the upper right corner of the plot. Default is
0.2.
Examples
d <- system.file("extdata", "setas-model-new-trunk", package = "atlantistools")
bgm_as_df <- convert_bgm(file.path(d, "VMPA_setas.bgm"))
vol <- agg_data(ref_vol, groups = c("time", "polygon"), fun = sum, out = "volume")
# Spatial distribution in Atlantis is based on adu- and juv stanzas.
# Therefore, we need to aggregate the age-based biomass to
# stanzas with \code{\link{combine_ages}}.
bio_spatial <- combine_ages(ref_bio_sp, grp_col = "species", agemat = ref_agemat)
#> Joining with `by = join_by(species)`
# Apply \code{\link{plot_spatial_ts}}
grobs <- plot_spatial_ts(bio_spatial, bgm_as_df, vol)
#> Joining with `by = join_by(time, polygon)`
#> `geom_line()`: Each group consists of only one observation.
#> ℹ Do you need to adjust the group aesthetic?
#> `geom_line()`: Each group consists of only one observation.
#> ℹ Do you need to adjust the group aesthetic?
gridExtra::grid.arrange(grobs[[1]])
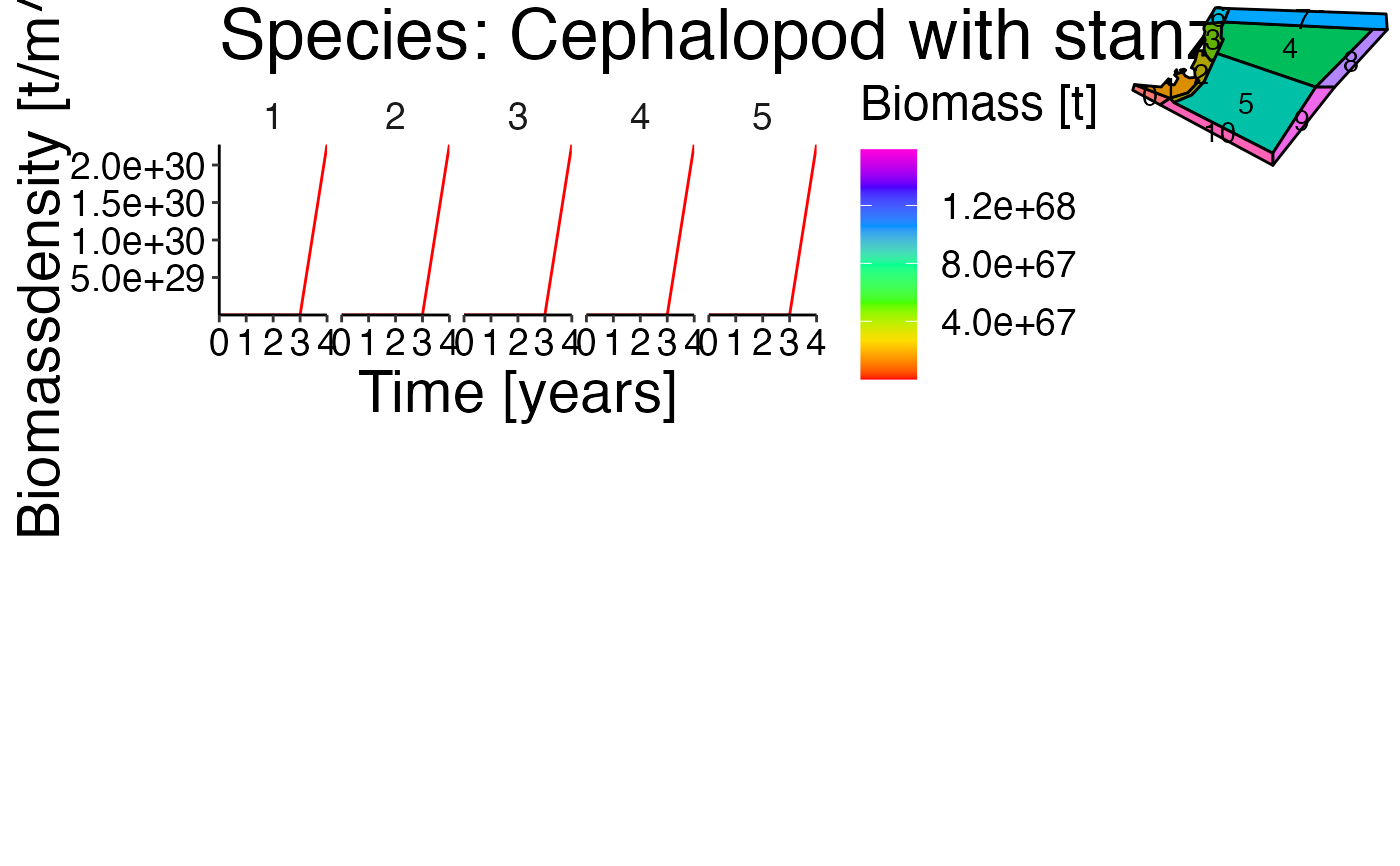 gridExtra::grid.arrange(grobs[[7]])