Low level plotting function to add sudo confidence range to calibration plots.
Source:R/plot-add-box.R
plot_add_box.RdLow level plotting function to add sudo confidence range to calibration plots.
Usage
plot_add_box(plot, range = c(0.5, 0.2))See also
Other low-level-plot functions:
plot_add_range()
Examples
# Make sure to use a relative timeseries generated with \code{\link{convert_relative_initial}}.
df <- convert_relative_initial(preprocess$structn_age)
# Create the plot with \code{\link{plot_line}}.
plot <- plot_line(df, col = "agecl")
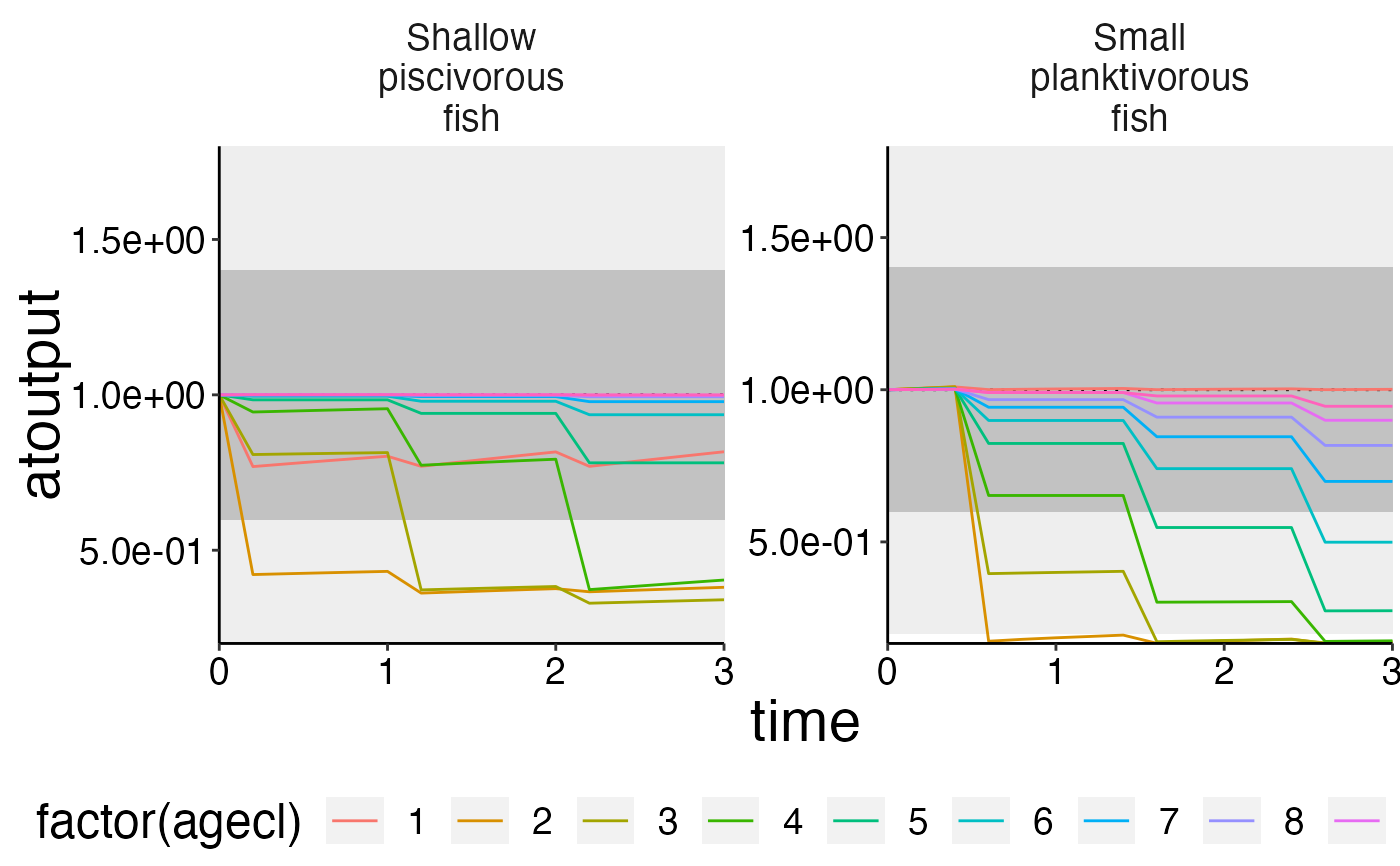
# Add lower and upper range.
plot_add_box(plot)
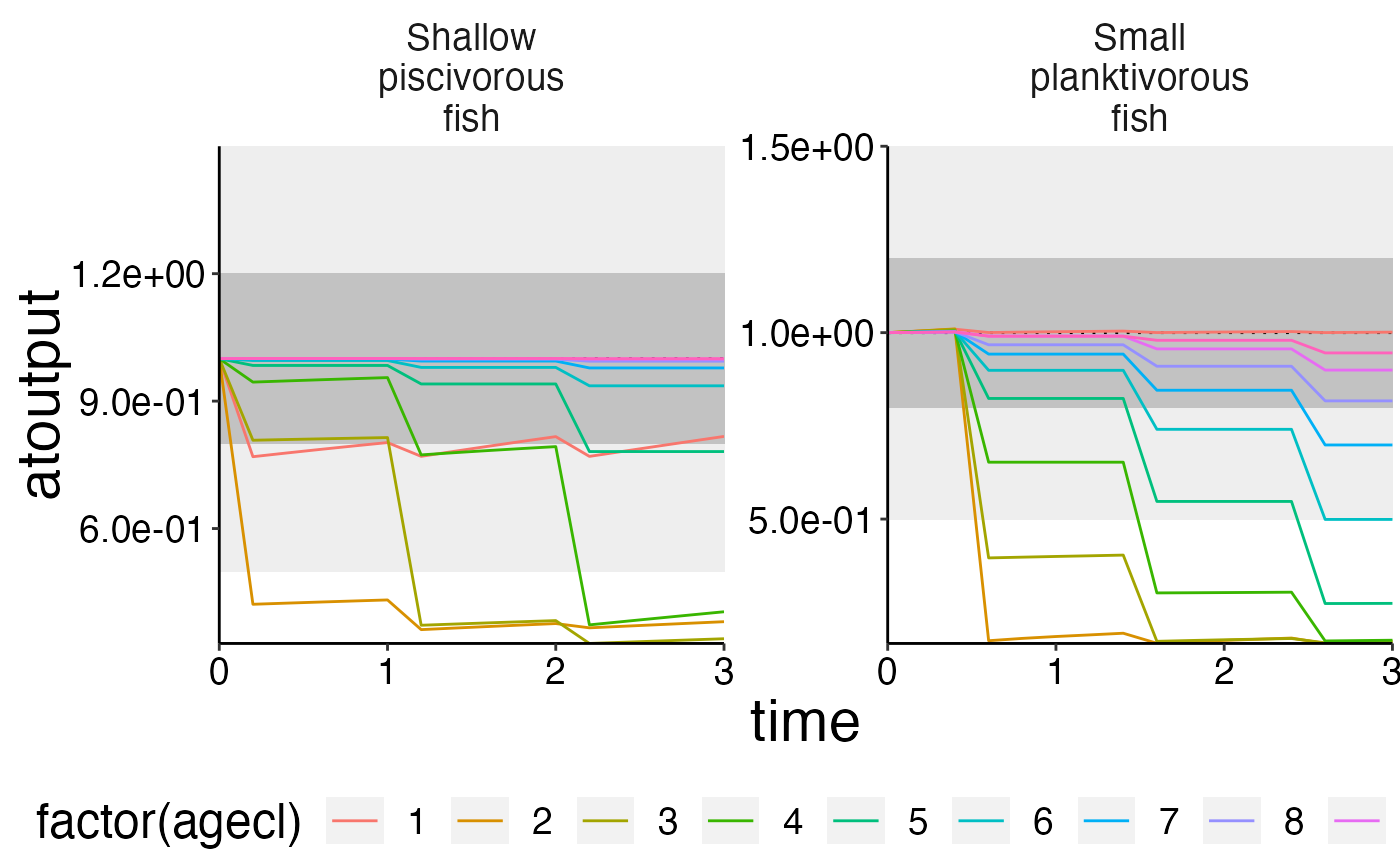 # You can set the upper and lower range as you like!
plot_add_box(plot, range = c(0.8, 0.4))
# You can set the upper and lower range as you like!
plot_add_box(plot, range = c(0.8, 0.4))