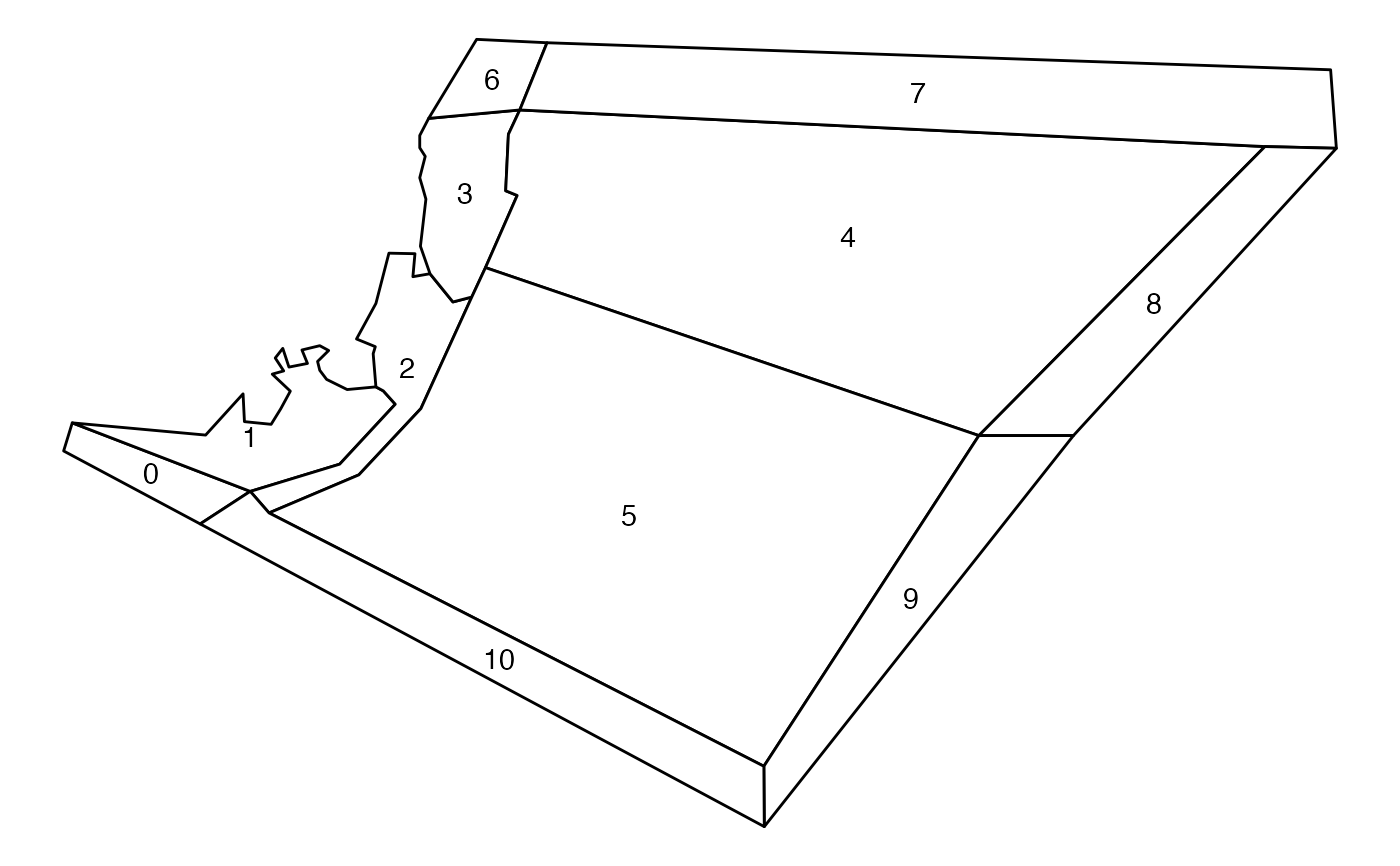
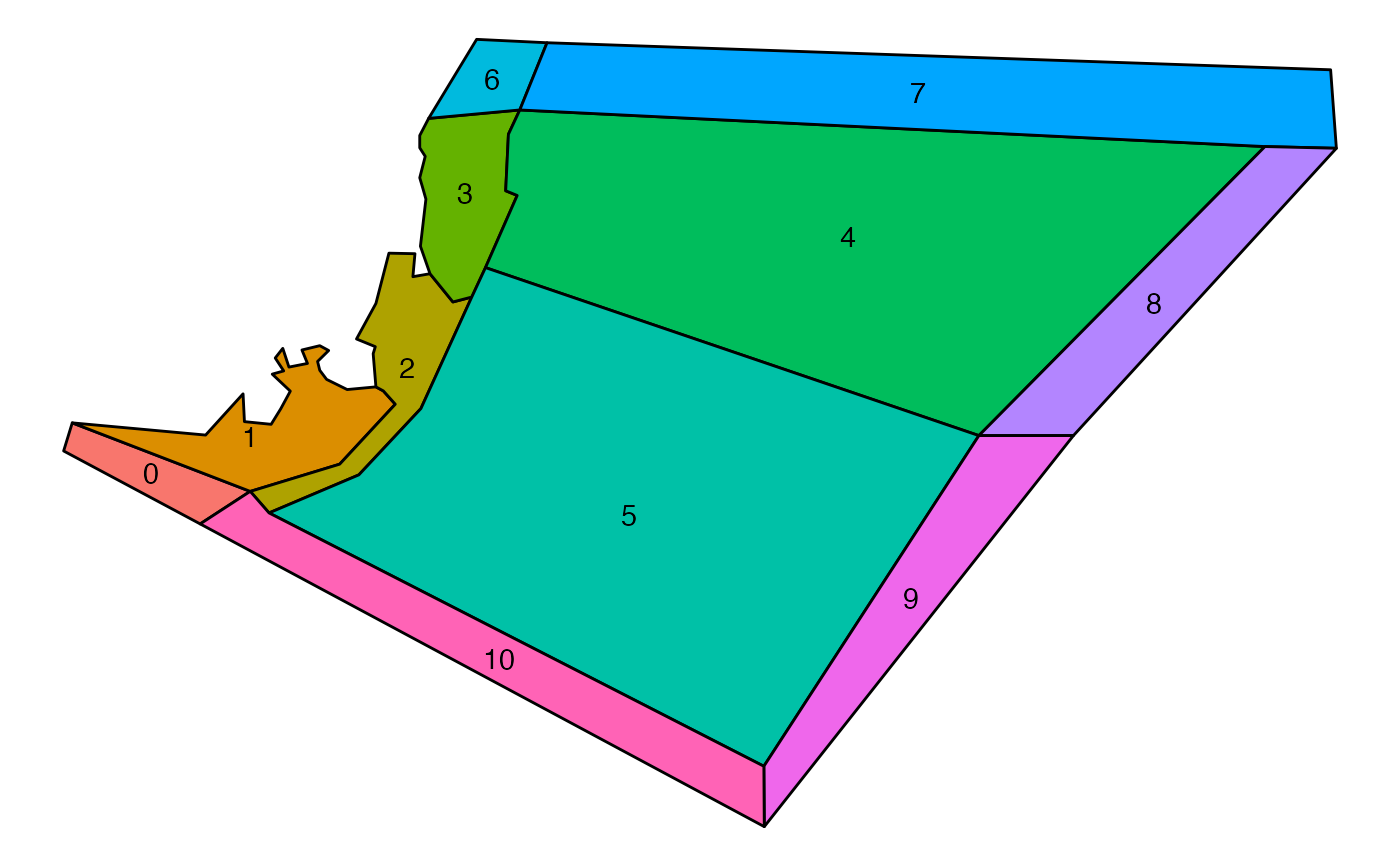
Plot layout of boxes!
See also
Other plot functions:
plot_bar(),
plot_diet(),
plot_line(),
plot_rec(),
plot_species()
Examples
d <- system.file("extdata", "setas-model-new-trunk", package = "atlantistools")
bgm_data <- convert_bgm(file.path(d, "VMPA_setas.bgm"))

# Use color coding for polygons.
plot_boxes(bgm_data)


# Only use text to indicate polygons.
plot_boxes(bgm_data, color_boxes = FALSE)
# Only use text to indicate polygons.
plot_boxes(bgm_data, color_boxes = FALSE)