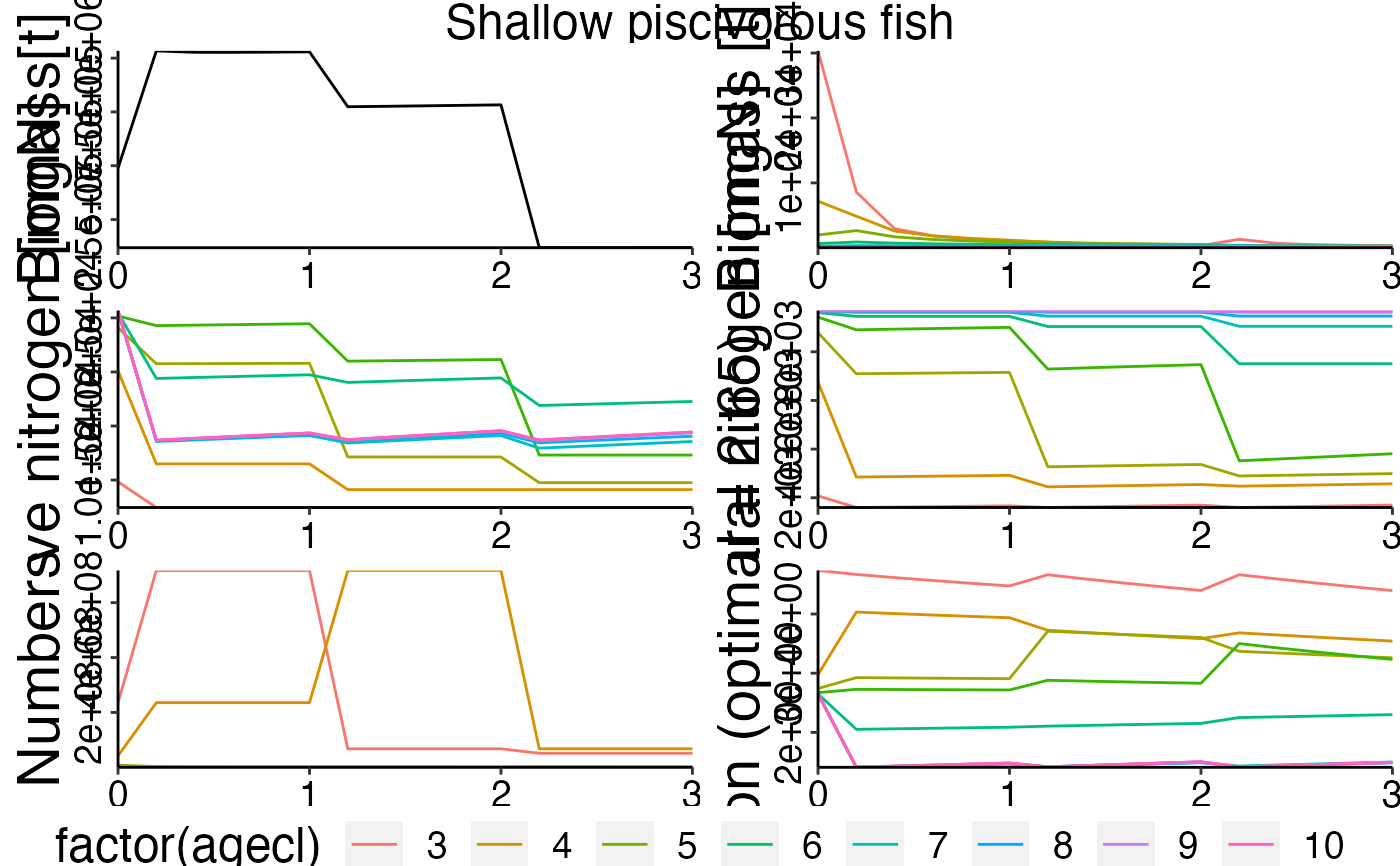
This plotting routine is based on Raphael's (Ifremer) plotting routine used during model calibration. Currently 6 plots are created by default: - Biomass over time - Biomass over time per age - StructN over time per age - ResN over time per age - Condition over time per age - Numbers over time per age
See also
Other plot functions:
plot_bar(),
plot_boxes(),
plot_diet(),
plot_line(),
plot_rec()
Examples
plot <- plot_species(preprocess, species = "Shallow piscivorous fish")
# Use grid.arrange to draw the plot on the current device
gridExtra::grid.arrange(plot)